


#Drawbridge100K Record Keeper
Spreadsheet to track weekly compounding investments with a video tutorial
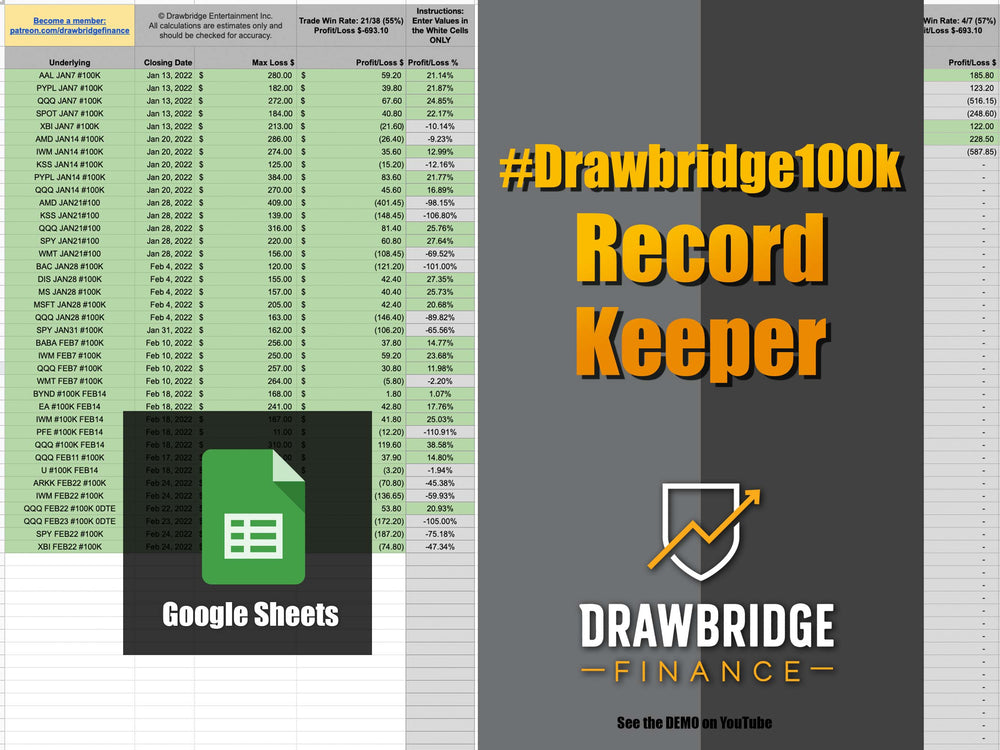
*** Digital Download: Google Sheets Spreadsheet ***
Trying to track specific trades to see if they are profitable? #drawbridge100k challenge spreadsheet tracker.
The spreadsheet tracks weekly limited loss trades with a specific weekly return goal.
It calculates weekly profit/loss and percentage return on risked capital:
• Weekly returns in dollars and percentages
• Compares to theoretical weekly return, estimates weeks to achieve goal
Download Includes:
• 1x Spreadsheet: Trade Tracker, showing capital at risk, weekly returns, percentage change
• 1x Chart: The investment value over time compared to a theoretical return.
Instructions:
The pdf has links to google drive where the spreadsheets can be copied.
*** Enter Values into cells that have a WHITE background colour only***
This chart is ideal for investors who want to quickly compare the return of a specific set of trades.
Check out video tutorial here:
By downloading digital products, you agree to join our marketing email list, where you'll receive updates, tips, and exclusive offers. You can unsubscribe at any time.