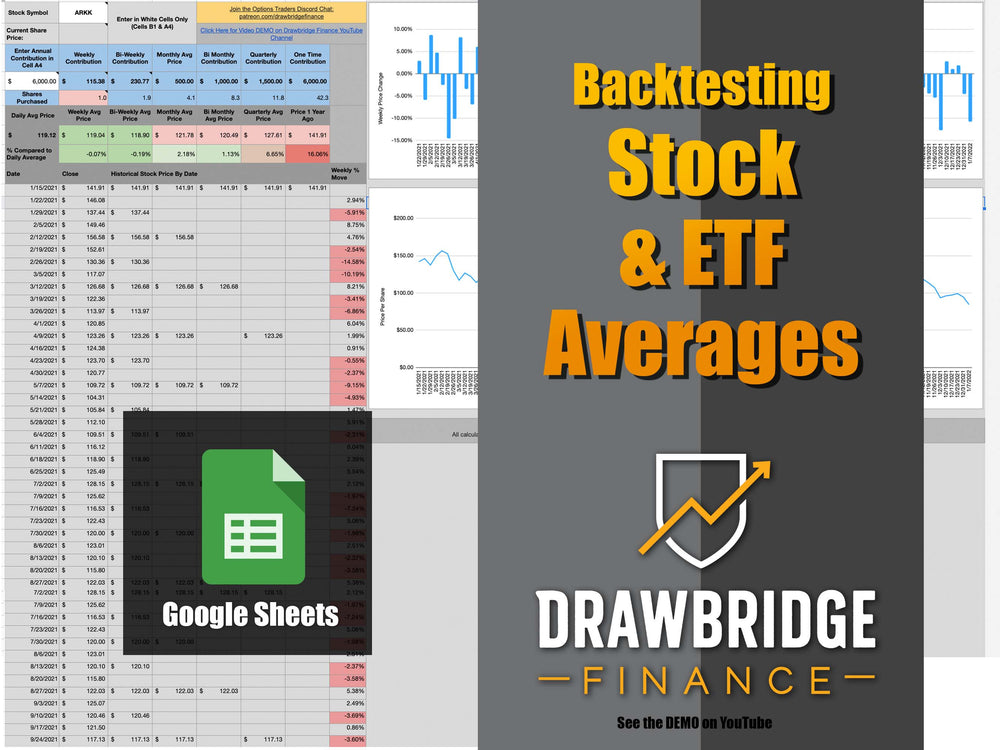
Backtesting Stocks & ETF Averages Spreadsheet
Spreadsheet to quickly calculate scheduled annual investments or daily percentage changes with two video tutorials:
https://youtu.be/0eeuUMIub_I https://youtu.be/J1xTcMlGnMM
*** Digital Download: Google Sheets ***
Weekly Tab:
Do you budget for annual savings and investments but can't decide when and where to invest it? This spreadsheet allows you to look at the past 12 month performance of a stock, ETF or index fund to help you decide. Whether you are trying to determine where to invest your TFSA, RRSP, ISAs or Roth IRA for maximum returns or are looking for an optimal window for annual contributions, this spreadsheet will take some of the guesswork out of your decision.
The spreadsheet analyzes a stock and a proposed annual contribution amount to help you plan potential future investment at an optimal interval.
It calculates the Average Price of the stock over the past 365 days and returns:
• Daily, Weekly, Bi-weekly, Monthly and Bi-monthly average prices if an investment had been executed at a regular interval.
• It also displays the number of stocks that could have been purchased per interval, to help plan future purchases.
Daily Tab:
Are you looking to day trade? The spreadsheet analyzes a stock or ETF and visually displays the average standard deviation move of the daily percentage gains or losses.
Allows for input targets of two specific percentage moves. Highlights and displays the top ten and bottom ten largest daily moves over the past year.
Download Includes:
• 1x Spreadsheet with 2x tabs
1. Weekly Tab: Weekly Historical prices of the stock or ETF, averages, quantities bought per interval and two charts that display the stock price over the past year, and the weekly percentage price move.
2. Daily Tab: Daily Historical prices and percentage moves of the stock or ETF. Three charts that display the stock price over the past year, and the daily percentage price move and the frequency of the daily percentages moves.
Instructions:
The pdf has links to google drive where the spreadsheets can be copied.
*** Enter Values into cells that have a WHITE background colour only***
This spreadsheet is ideal for investors who want to quickly compare the benefits of regularly scheduled investment in the stock market. Or to compare the daily frequency of percentage moves for day trading.
Check out the videos demos.
Daily Sheet Video Instructions:
Weekly Sheet Video Instructions:
By downloading digital products, you agree to join our marketing email list, where you'll receive updates, tips, and exclusive offers. You can unsubscribe at any time.