


Dollar Cost Averaging Spreadsheet: Calculate Adjusted Cost Basis
Spreadsheet for using Dollar Cost Averaging to Calculate Adjusted Cost Basis
*** Digital Download: Apple Numbers and Microsoft Excel Spreadsheet ***
It can track the purchase and sales of stocks in various quantities and track the average cost basis, even when only a portion of the holdings have been sold off.
This is especially important for income tax reporting and it has an adjustment column for tracking income from using options to either buy or sell shares.
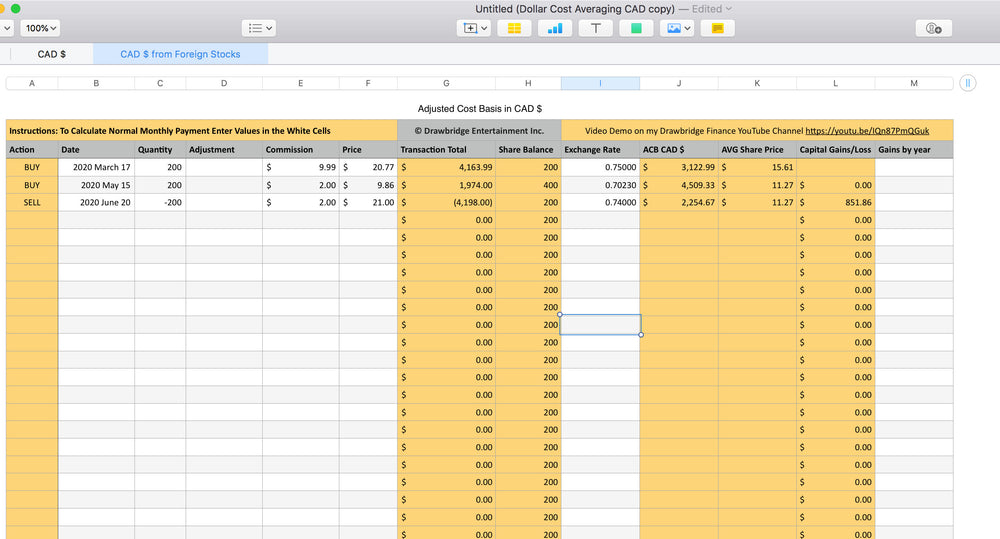
To use the chart simply enter the transaction information including, Date, Number of shares traded, Adjustment value, Commission and Stock Price.
The chart will calculate the current number of shares being held in the account, the adjusted cost basis, the average price per share and any capital gains that need to be reported.
*** Enter Values into cells that have a WHITE background colour only ***
Each file contains 2 spreadsheets (Foreign and Domestic).
There are three versions available with this purchase, but you only need one.
• Microsoft Excel Users: The XLSX version can be used with any currency.
• Apple Numbers Users: Either USD or CAD version depending on the country you file taxes in. Canadians would use the CAD version. Americans should use the USD version.
Check out the video demo:
By downloading digital products, you agree to join our marketing email list, where you'll receive updates, tips, and exclusive offers. You can unsubscribe at any time.