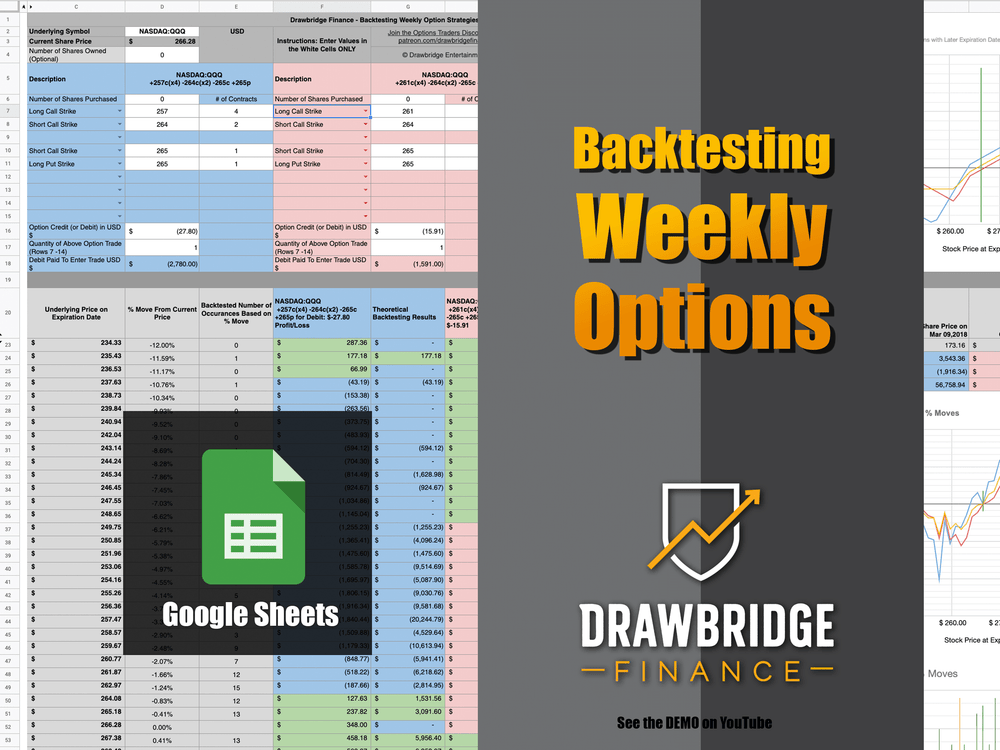


Backtesting Weekly Options Spreadsheet
Spreadsheet to backtest weekly options strategies:
https://youtu.be/1DWNH-0cc5k
*** Digital Download: Google Sheets ***
Download Includes:
• 1x Google Sheets Spreadsheet with 2x tabs
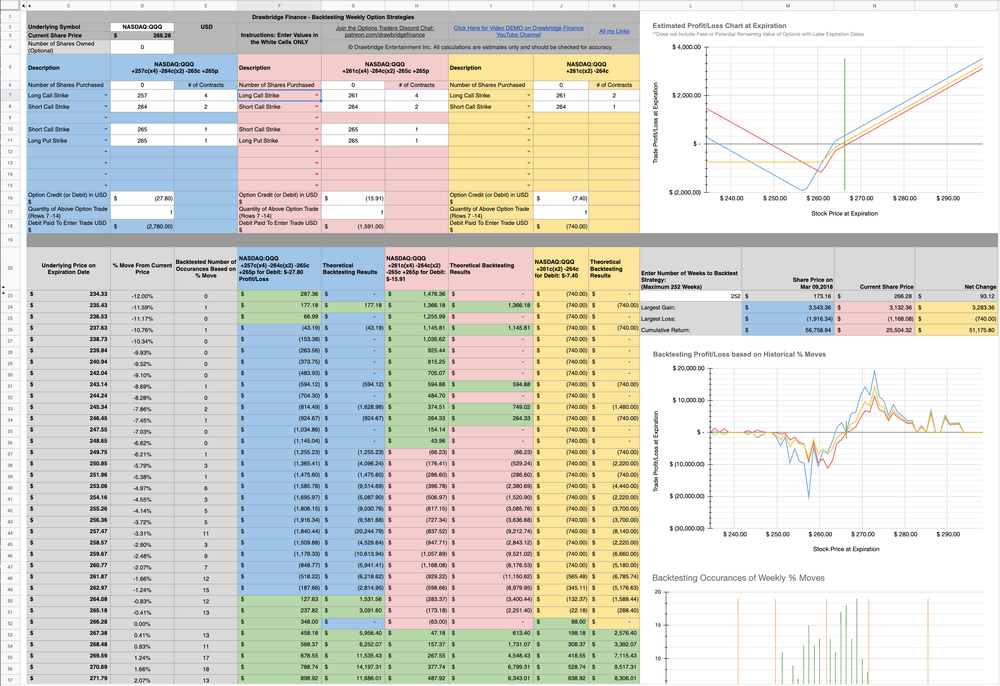
1. Complex Options Comparison with Backtest:
Graphically compares up to three complex options trading strategies
- each strategy can include up to eight legs
- each leg can have any quantity
- stock purchases can be added per strategy
- Backtests the cumulative results of each strategy using current valuation vs historical moves based on up to 252 weeks from the current market value.
Note: This does not chart date data or extrinsic value so diagonal spreads are charted for intrinsic value only. Chart does not display return on investment or return over time.
2. Backtesting Weekly Moves Tab:
Are you looking to place consistent weekly trades using options? The spreadsheet analyzes a stock or ETF and visually displays the average standard deviation move of the daily percentage gains or losses.
Allows for input targets of two specific percentage moves. Highlights and displays the top ten and bottom ten largest weekly moves of up to 252 weeks
- Displays weekly historical prices, percentage moves and the number of occurrences of the percentage moves
Instructions:
The pdf has links to google drive where the spreadsheets can be copied.
*** Enter Values into cells that have a WHITE background colour only***
This spreadsheet is ideal for investors who want to backtest the historical potential results of regularly entered weekly options strategies on a stock or ETF.
Check out the videos demo:
By downloading digital products, you agree to join our marketing email list, where you'll receive updates, tips, and exclusive offers. You can unsubscribe at any time.