


Tracking Historical Option Selling Trades to Predict Annual Returns
Spreadsheet Tracks Historical Option Selling Trades to Predict Annual Returns.
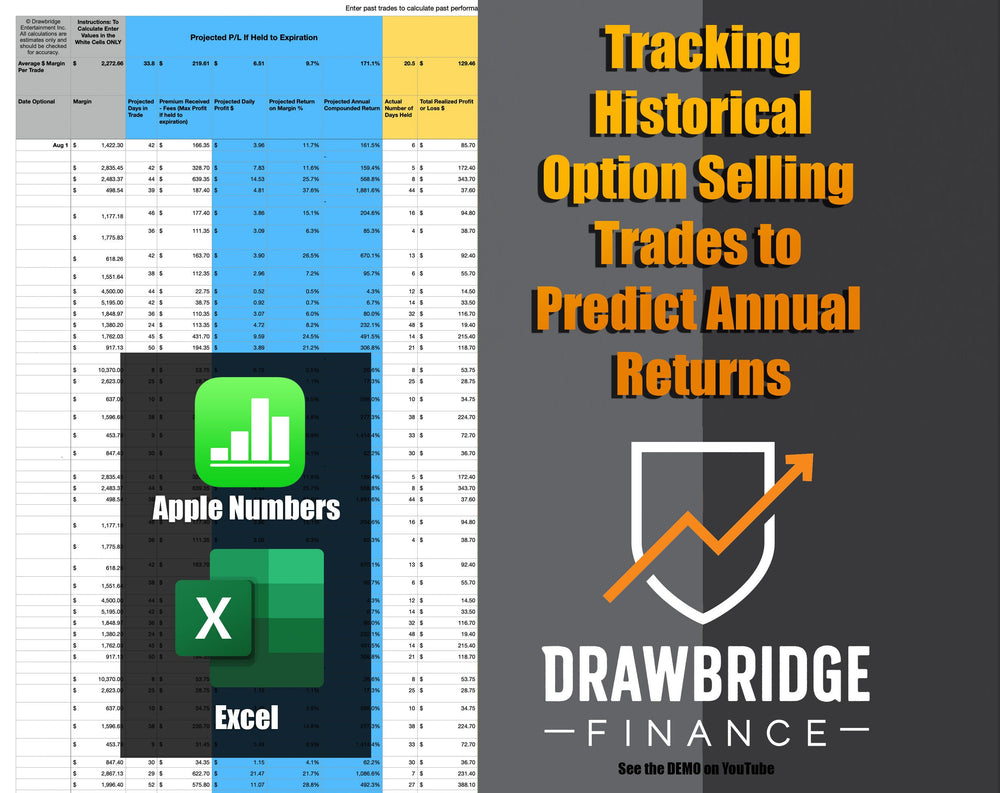
*** Digital Download: Apple Numbers and Microsoft Excel***
This spreadsheet is suited for the analysis of options strategies that begin with a net credit like naked puts, naked or covered calls, straddles, strangles, iron condors, iron butterflies, bull put spreads, and bear call spreads. The more data that is entered into this chart, the more realistic the potential outcome.
To use the chart, simply fill in the white cells.
For each trade, enter the date, the margin requirement, the days to expiration, the premium received from the trade on entry.
In the realized profit/loss section, enter the actual number of days held and the realized profit or loss.
On the right hand side there is a summary sheet which can project potential % returns based on average historical daily returns or the average return on margin per trade.
*** Enter Values into cells that have a WHITE background colour only***
This spreadsheet has 1 sheet with multiple versions depending on your choice of software:
• Apple numbers with Currency formatted in USD
• Apple numbers with Currency formatted in CAD
• Microsoft Excel
Check out the video demo here:
By downloading digital products, you agree to join our marketing email list, where you'll receive updates, tips, and exclusive offers. You can unsubscribe at any time.